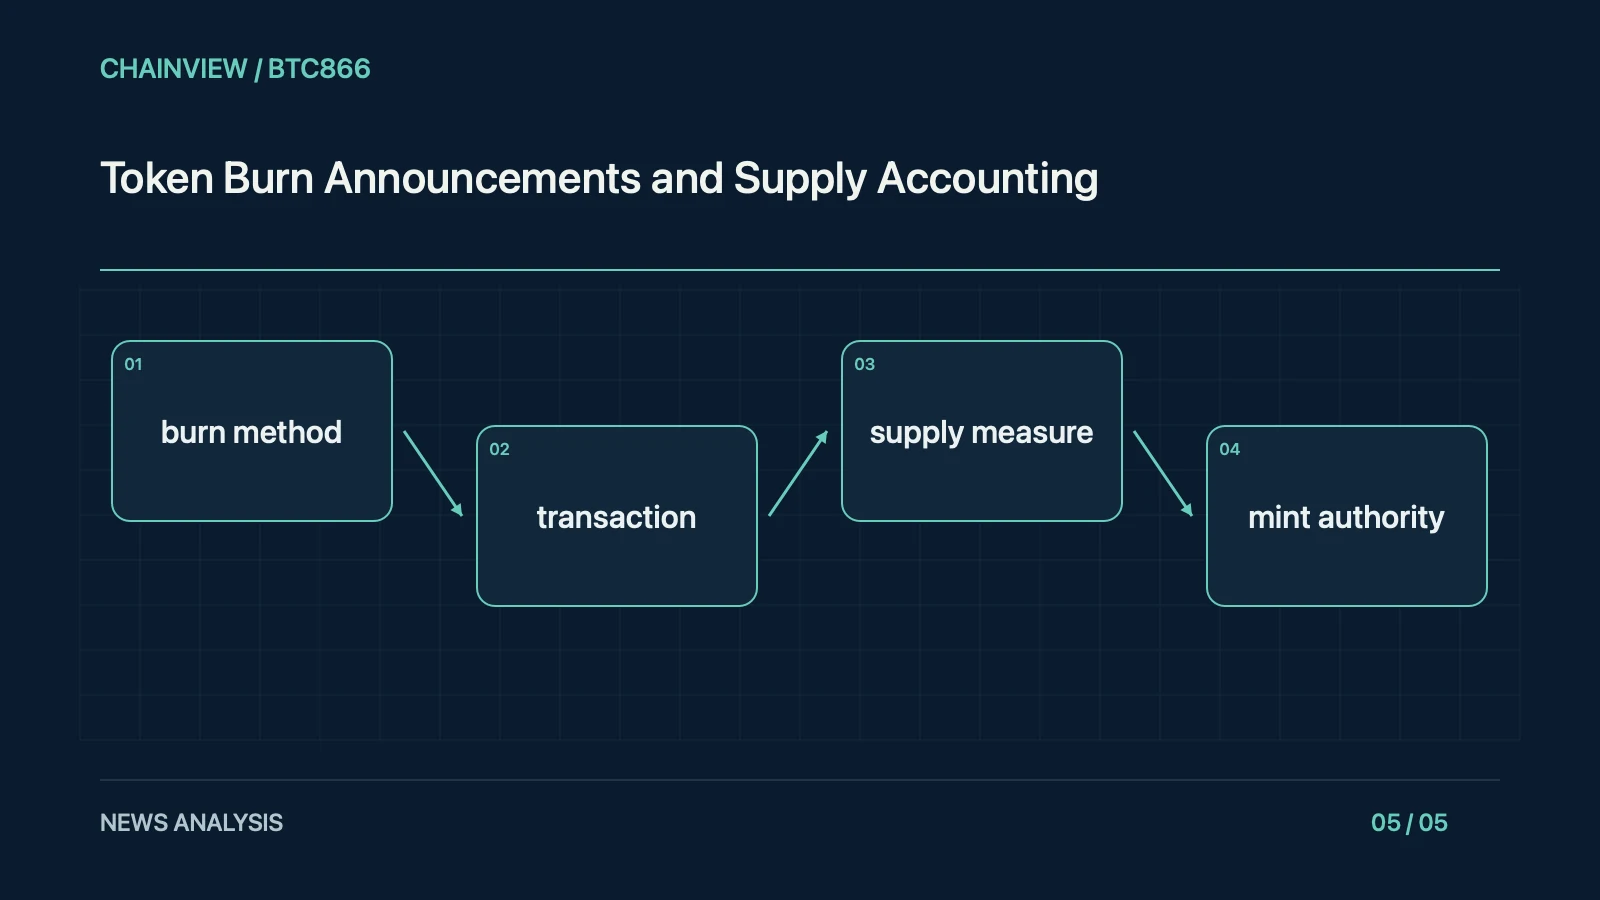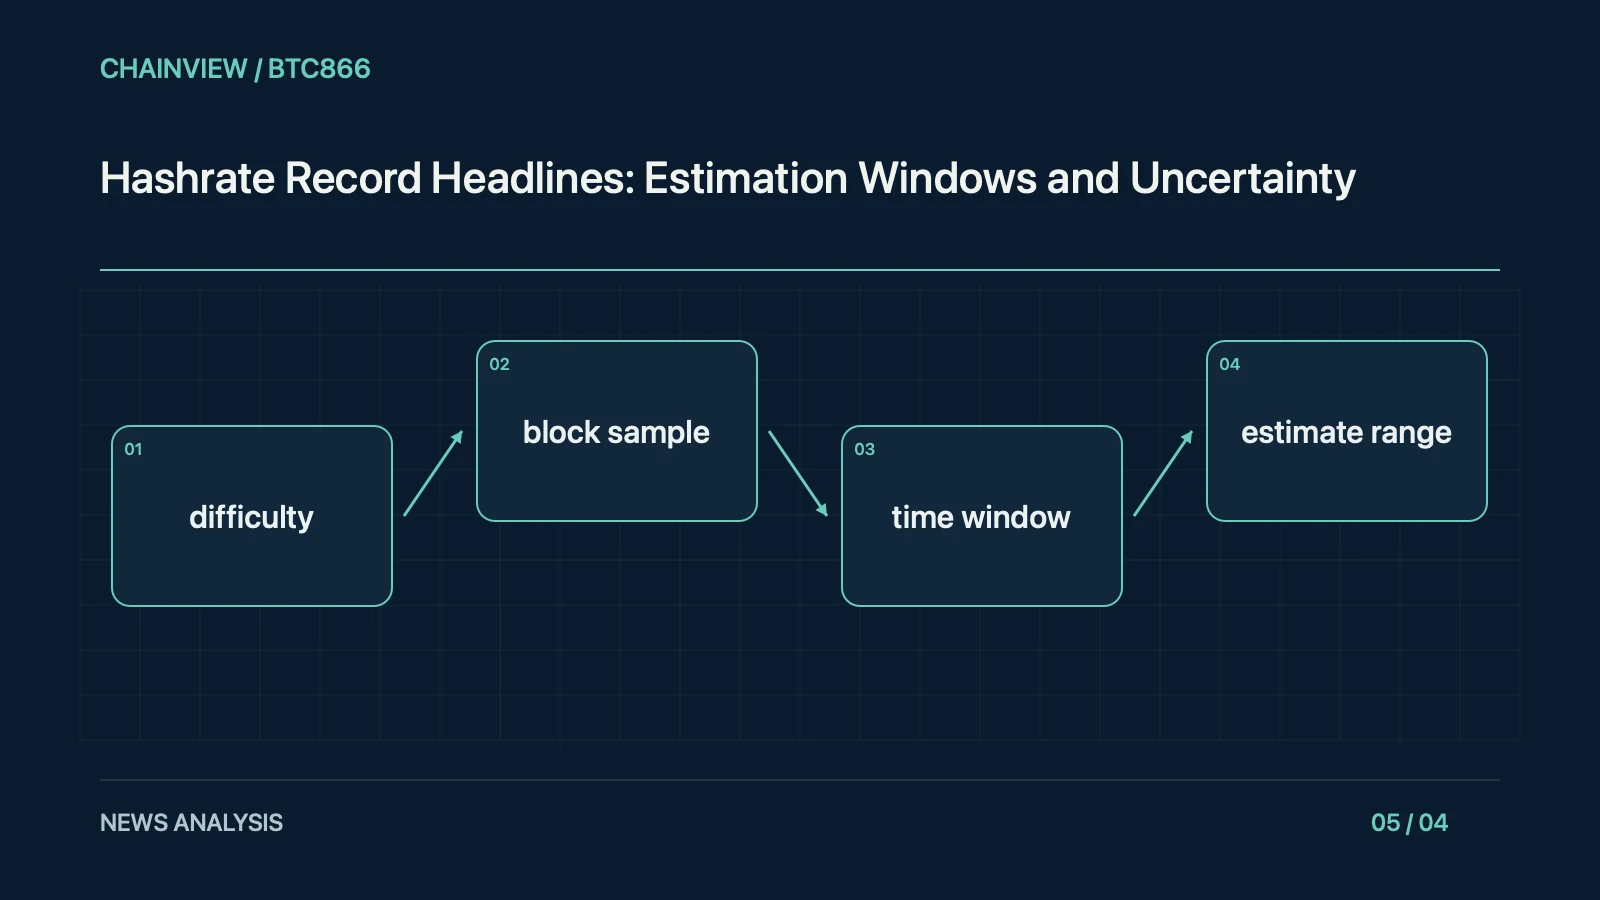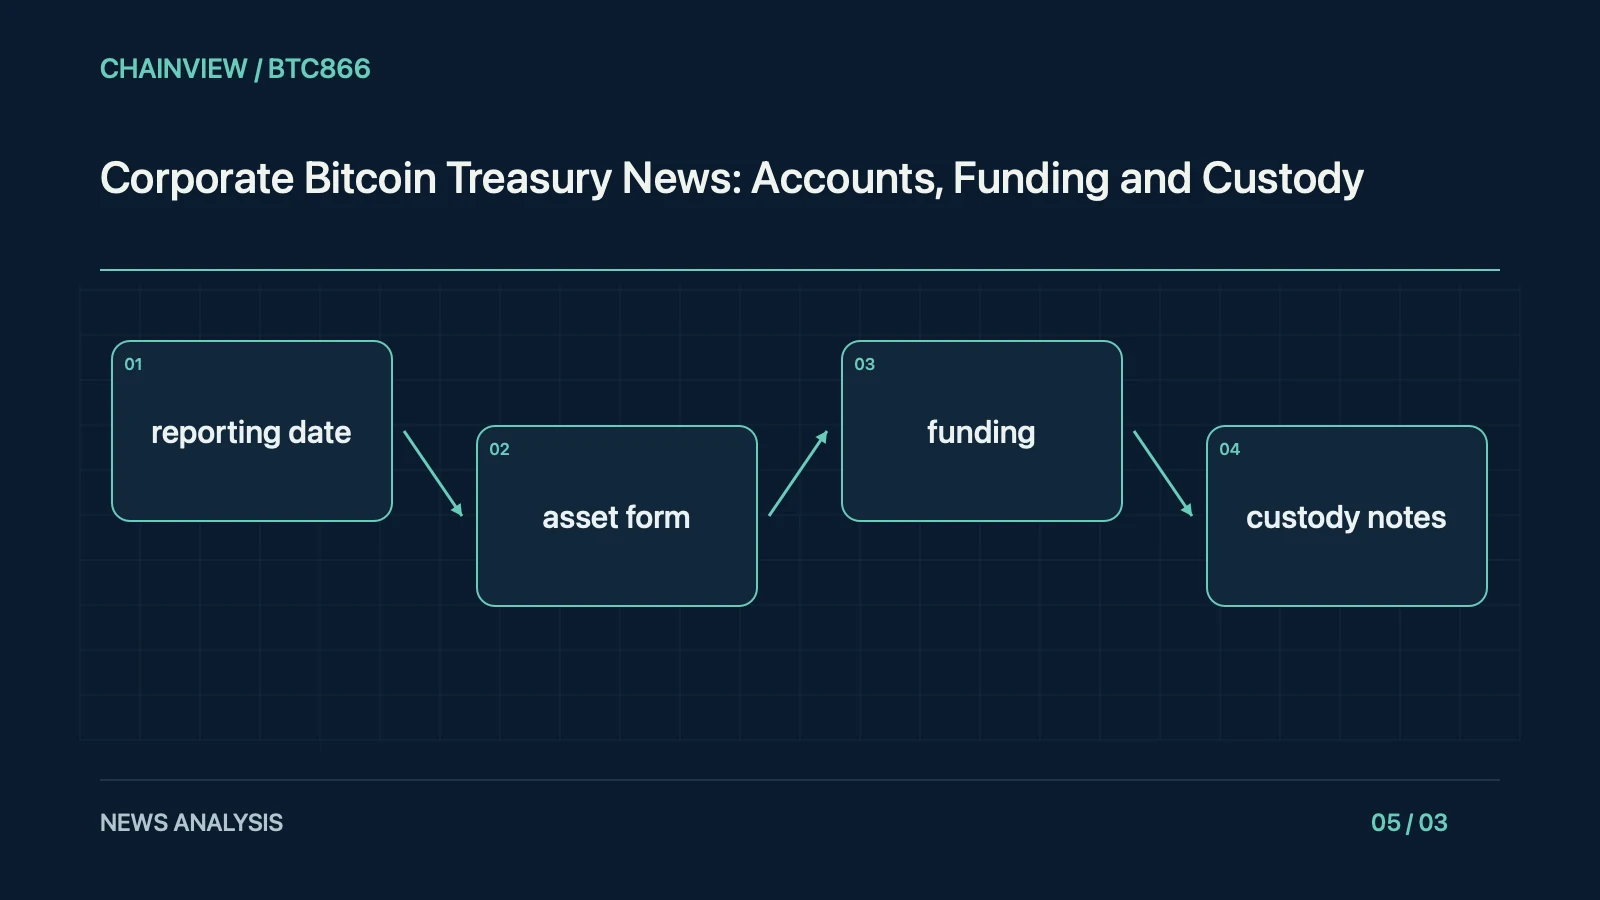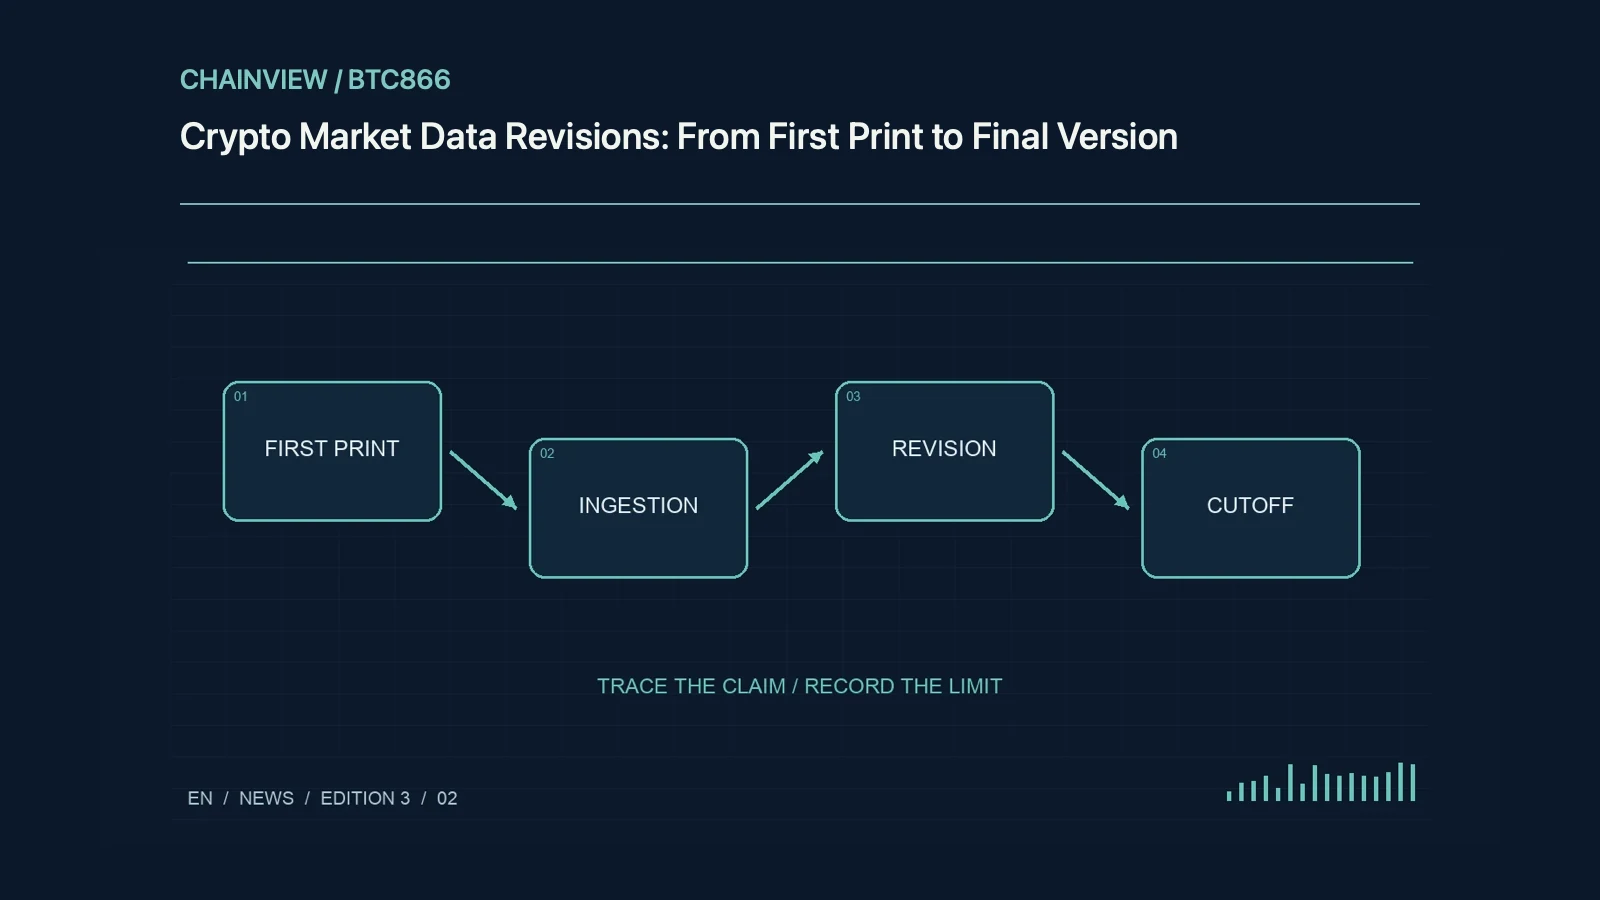
Original topic illustration: ChainView BTC866 original topic diagram · ChainView BTC866 Editorial · CC BY 4.0
Begin with the metric definition
A revision can reflect missing observations, a correction, or a changed definition. Volume may count trades differently; circulating supply depends on exclusions; price can mean last trade, an index, or a snapshot. Save methodology, venue coverage, units, and frequency before comparing files. Distinguish changes in measurement from changes in market activity, and do not infer misconduct solely because a number was revised.
Fix the time and version window
Record event, ingestion, publication, and revision times. A screenshot cannot preserve this lineage. Daily statistics need an explicit timezone boundary. Backfilling a missing hour is not new demand. Keep first-release and revised series separately when studying historical decisions: one describes information available then, while the other describes the later reconstructed record. Mixing them creates hindsight bias in research and backtests.
Separate errors from real outliers
An unusual price can be a genuine trade in a thin market, although unsuitable for a reference rate. Check size, status, venue notices, and feed errors against a stated policy. Trace supply changes to minting, burning, unlocks, or classification. Several agreeing dashboards may share one upstream provider, so count independent evidence rather than the number of screens displaying the same figure.
Publish revision notes and effects
Suppose initial volume was one hundred million and becomes one hundred twenty million after a missing venue is added. Report the coverage correction separately from growth. Publish affected dates, old and new values, reason, and effect on conclusions. If an article relied on the earlier number, update its headline, caption, and structured data as needed, while retaining a correction note that makes the change reproducible.