Original topic illustration: ChainView BTC866 original topic diagram · ChainView BTC866 Editorial · CC BY 4.0
Establish the concept
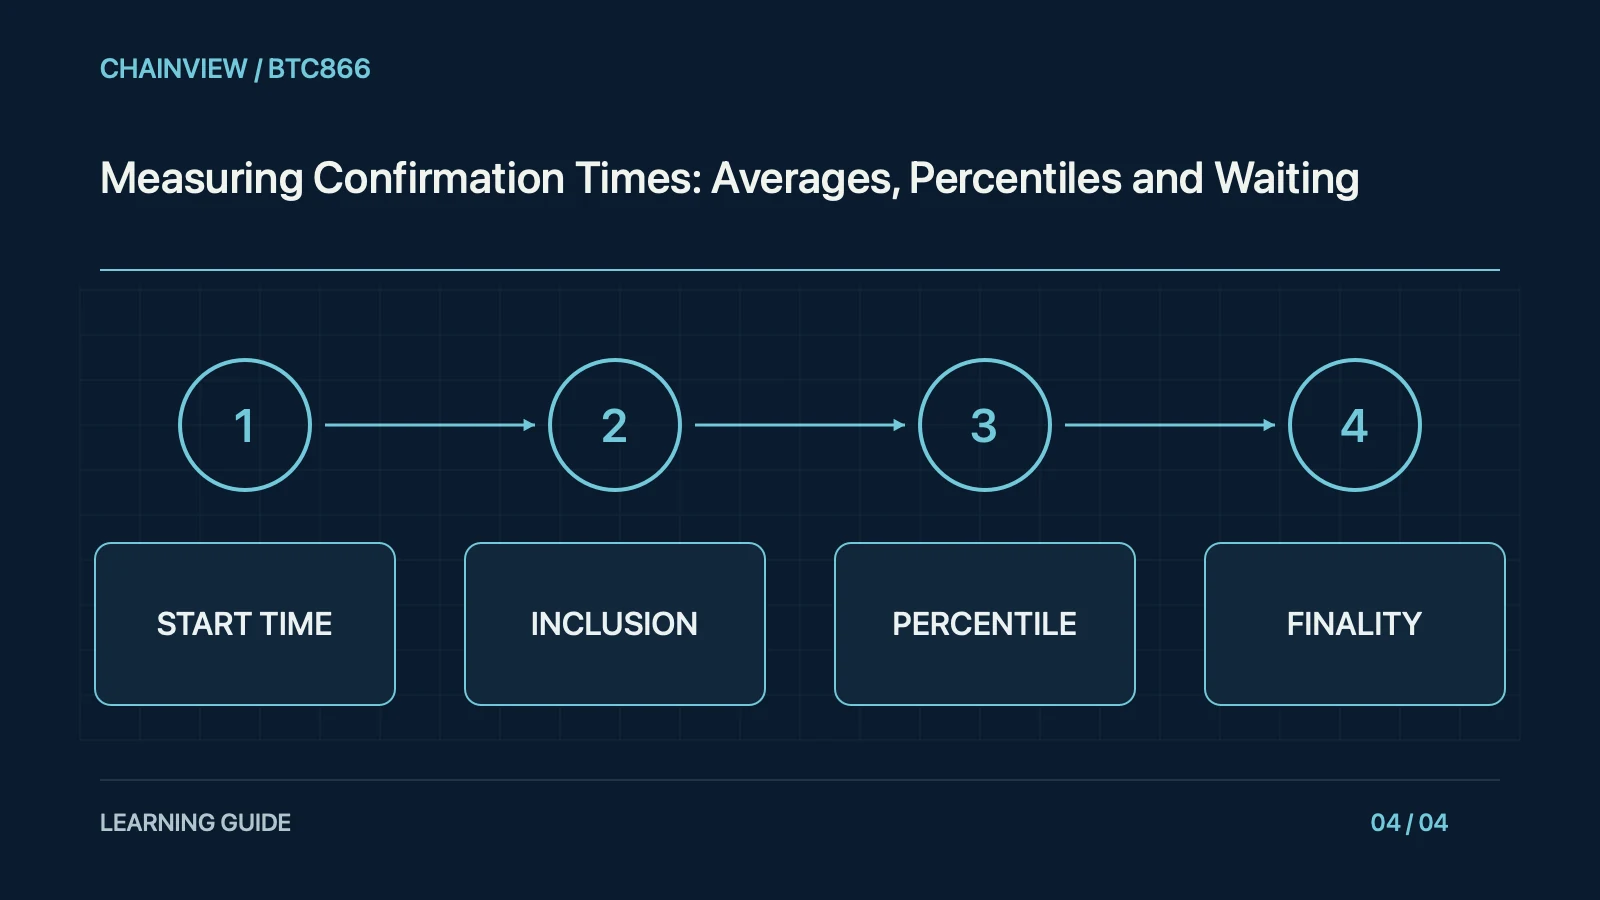
Average block spacing is not a waiting-time promise for an individual transaction. Inclusion in a block, a chosen confirmation count, and finality are separate milestones. Fees, congestion, transaction validity, and node observation can change the wait. Define the research question before collecting data. A network's advertised block cadence should not become a claim that every user completes settlement within that number of seconds.
A collector should fix the query window and avoid mixing an unfinished newest interval into a complete sample. With multiple nodes, record endpoint observation delay as a variable. The fastest observation is not automatically the user's submission time, and choosing it can bias the apparent waiting distribution.
Choose reliable evidence
The start can be a user clicking submit, wallet broadcast, node acceptance, or a collector's first observation. Endpoints also vary. Record timestamp sources, time zones, clock synchronisation, and measurement logic. Client time and block time cannot always be subtracted without qualification. Several RPC endpoints may observe different propagation times. Choosing one is acceptable when disclosed; selecting the fastest observation and presenting it as the experience of all users is not.
Finality depends on the network and the application. Some services require a confirmation count rather than the protocol's own finality milestone. State the chosen completion standard and why it matters. A reader should know whether complete means included, sufficiently confirmed, economically final, or credited by an external platform. These are different outcomes even when their timestamps are close.
Check concrete fields
The median describes the middle observation, while higher percentiles reveal tail waits and a mean can be pulled by extreme values. Publish sample size, window, and distribution rather than one attractive number. In a fictional sample of waits of one, two, three, four, and one hundred units, the median is three while the mean is twenty-two. They answer different questions. The example illustrates a statistical distinction, not a current performance result for a network.
Define how replaced, expired, or failed transactions enter the percentile calculation. Do not hide removed observations. For pending samples, report the unresolved share at the cutoff alongside completed-case statistics. A dataset that records only successful completions answers a narrower question and should be labelled as such rather than presented as the speed experienced by every submitted transaction.
Handle boundary cases
Excluding every still-pending transaction can make a sample appear artificially fast. Preserve the observation cutoff and pending count and explain any censoring method. Lost tracking, replacement, expiry, and genuinely quick completion also require separate treatment. A hash not found by one source should not automatically become zero wait or failure. Investigate collection coverage and endpoint status before assigning an outcome. Otherwise a monitoring limitation can become a misleading performance conclusion.
When comparing fee policies, keep transaction size, call complexity, and observation period reasonably similar. Otherwise the difference can reflect load or request composition rather than the policy. A small sample can support a descriptive note but not a network ranking or service promise. Display uncertainty and sample size near the headline number, not only in a distant methodology link.
Keep results and versions
Comparisons across networks or fee policies need consistent windows, start and end definitions, transaction types, and finality criteria. State unavoidable differences and uncertainty. Observing that ninety-five percent completed within a period does not promise that future transactions will meet it, nor does it necessarily establish legal settlement finality. Preserve dataset and method versions when updating the article. Readers then learn what waiting statistics describe without being offered a fixed-second guarantee that the evidence cannot support.
When data is backfilled or corrected, retain the previous report, reason for revision, and new result. Do not move boundaries merely to make two charts agree. A transparent method and an honest correction are more useful than a precise-looking number whose inclusion rules no one can reproduce. Versioned observations let readers see whether the conclusion changed because the network changed or because the measurement was improved.