Original topic illustration: ChainView BTC866 original topic diagram · ChainView BTC866 Editorial · CC BY 4.0
Define utilisation first
A lending pool's utilisation commonly relates borrowed assets to supplied liquidity under its own accounting. Denominators and interest calculations vary. High utilisation can reduce withdrawable liquidity and does not automatically mean safer yield.
Some models include cash, borrowing and reserves in a particular denominator, with different treatment of bad debt. Map formula terms to official or chain fields. Two labels called supply do not ensure identical measures. When a definition is unclear, retain the original term and documentation instead of inventing equivalence.
In a pooled lending market, utilisation relates borrowed assets to the supplied liquidity under the protocol's own accounting definition.
Understand the kink
Many models use a gentler slope below a kink and a steeper borrowing rate above it. Parameters, asset risk and oracle conditions can change the curve. Mark charts with date and version rather than treating a historic curve as permanent.
A kink is a parameter, not a market guarantee. Governance can change the curve, and emergencies may use other controls. Reconstruct historical rates with the parameters then in force. Mark fictional assumptions in diagrams so they are not mistaken for current borrowing demand in a real asset market.
An interest-rate curve may become steeper above a chosen kink to discourage borrowing and attract supply when available liquidity is scarce.
Borrower and supplier rates differ
Borrower interest is not necessarily all passed to suppliers. A reserve factor or other charge can be retained, and idle liquidity affects supplier rates. The difference is not a guaranteed net return.
Supplier rates can depend on utilisation and reserve deductions, while reward tokens may be displayed separately from base interest. Keep native interest, subsidies and fiat conversion distinct. A reward estimate is not stable cash, and stopping incentives can change effective returns; inspect actual credited amounts rather than only the headline.
The supplier rate differs from the borrower rate because only part of the pool is borrowed and the protocol may retain a reserve share.
Keep liquidity and principal separate
A displayed supply rate cannot remove withdrawal limits, asset devaluation, contract risk or borrower default. Floating annualised rates are not deposits or principal guarantees. Token prices and network costs affect realised results.
Redeemable value depends on available liquidity and protocol rules, not the displayed annual rate alone. High borrowing demand can leave little cash. Raising rates is an incentive mechanism, not a promise that liquidity immediately returns. Assess asset and contract risks alongside the curve instead of treating its shape as protection.
Use an illustrative curve with clearly hypothetical inputs, and check live parameters and withdrawal liquidity rather than treating a displayed floating rate as fixed income.
Review a hypothetical curve
With 100 supplied and 50 borrowed, utilisation is 50 percent; raising borrowings to 90 shows how a kink may change the rate and reserve deduction. The figures are illustrative. Check live parameters, withdrawable balance and administration before any real transaction.
A rehearsal can compare two utilisation levels and show borrower rate, supplier rate and retained reserve. Preserve units, observation time and formula version without using real funds to manufacture congestion. The walkthrough explains a floating mechanism; it is not a recommendation to borrow, add leverage or expect protected principal.
An illustrative chart can plot borrowing and supplier rates together, with the utilisation axis explicitly defined. Mark the kink as a model parameter instead of a forecast target. If rewards are shown, put them on a separate series and identify their denomination. This prevents a temporary token incentive from being mistaken for the underlying interest curve. Retaining that distinction also makes historical comparisons clearer after an incentive programme ends or governance changes the reserve deduction.
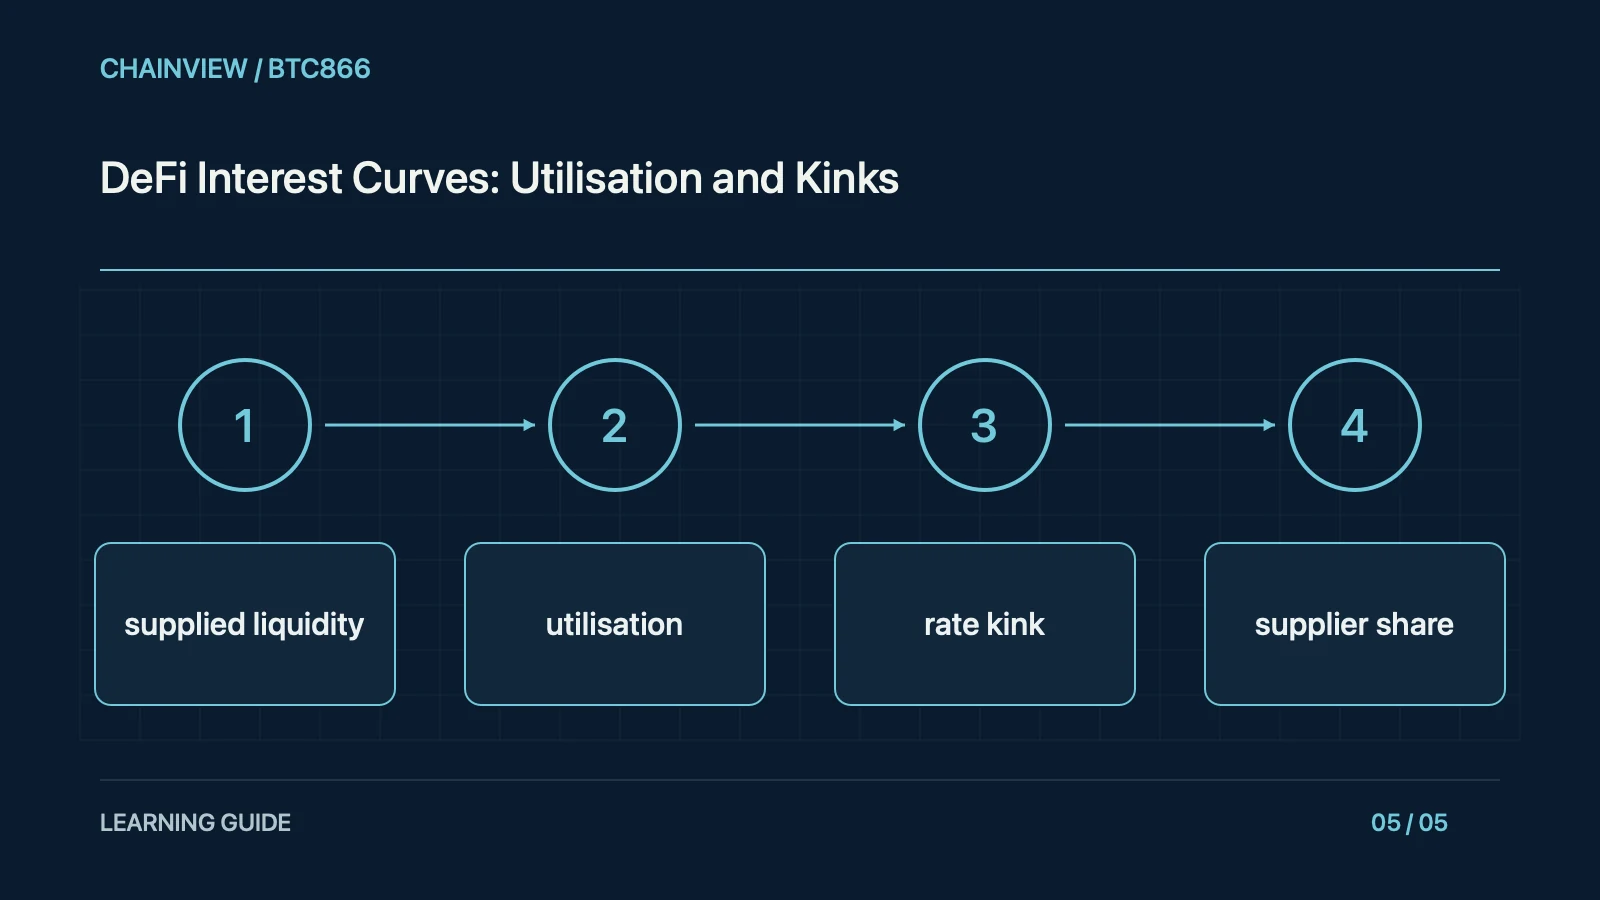
For the practice record, organise supplied liquidity, utilisation, rate kink and supplier share into concept, fictional input, observed result and limitation. Check units and timing step by step, distinguishing a mathematical result from a tool interpretation. Leave an uncertain field unresolved instead of guessing merely to complete the table. Learning does not require a live private key or a large transaction; preserving method and version is sufficient. Before carrying the lesson into a real service, recheck present software behaviour, charges and local eligibility. A walkthrough teaches a way to ask better questions rather than certifying every provider that uses similar labels.