Original topic illustration: ChainView BTC866 original topic diagram · ChainView BTC866 Editorial · CC BY 4.0
Open interest is not a direction signal
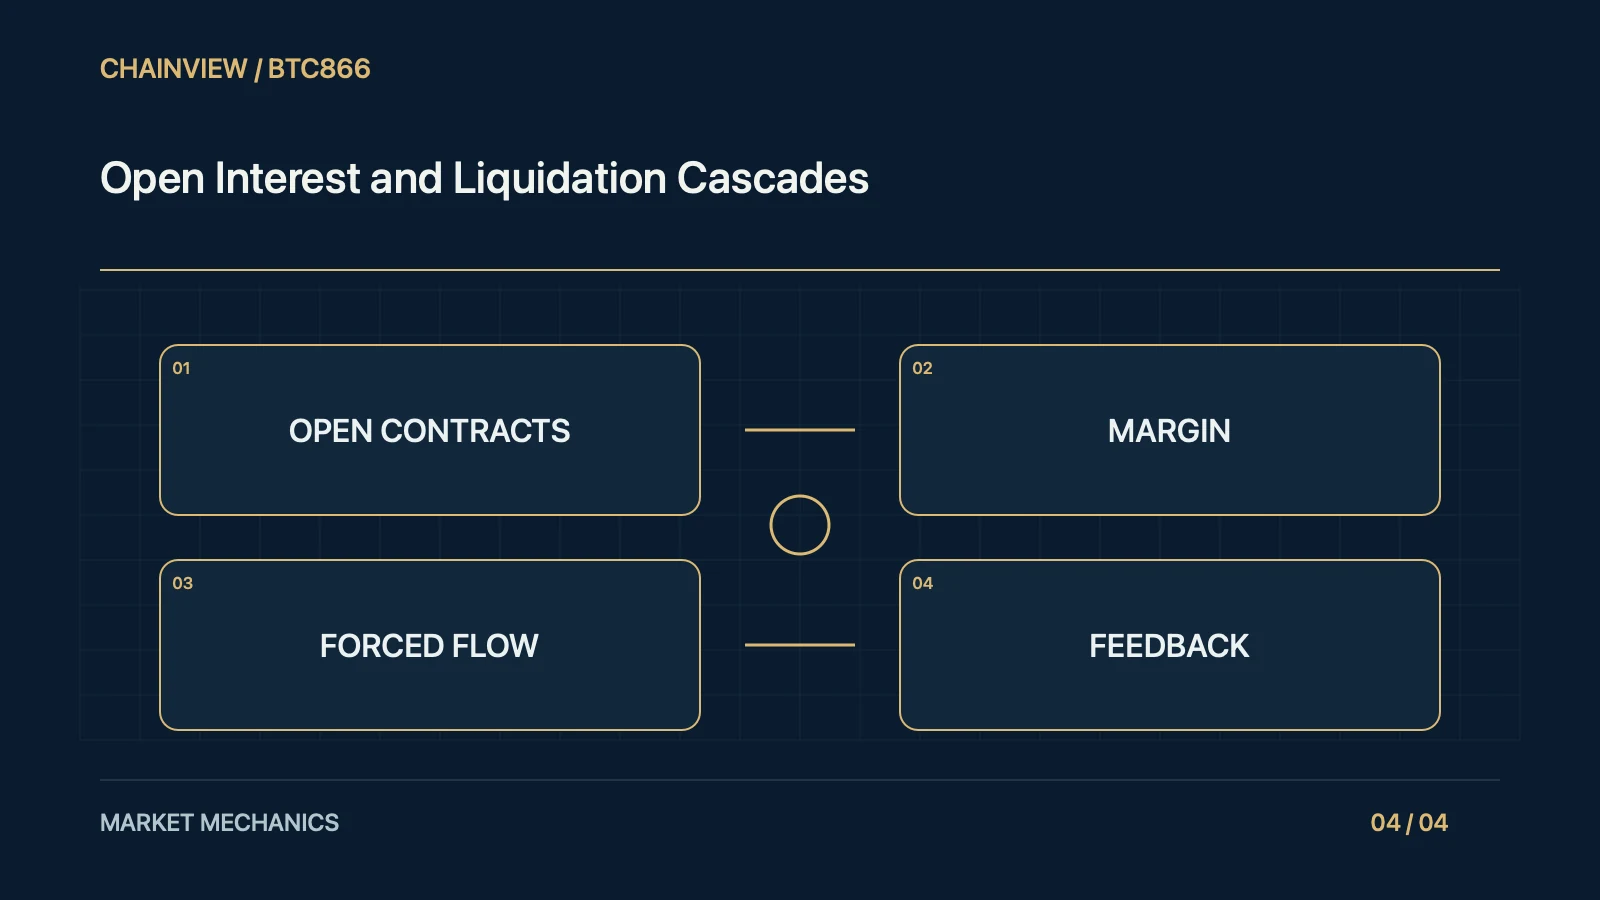
Every open derivative contract has both a long side and a short side. Rising open interest shows that the stock of unclosed contracts increased; it does not, by itself, identify a bullish market view. Trading volume measures activity over an interval, while open interest is a position measure at a point in time. Opening, closing, and transferring exposure can create several combinations of those indicators. Separate perpetuals, dated futures, options, and spot markets before drawing comparisons. Record expiries, contract multipliers, observation times, and the set of venues covered. A combined curve can look authoritative while mixing instruments with very different payoff structures, risk rules, and meanings of one contract.
Normalise units before comparing
A venue may report open interest as contracts, base-asset units, or dollar notional value. Inverse and linear products can require different conversions. If the asset price rises, dollar notional can increase even when the number of contracts does not, so apparent growth is not necessarily new money entering. Preserve the contract specification, multiplier, reference price, exchange rate, and formula used. In a fictional example, ten contracts each representing one asset unit have notional value of one thousand at a price of one hundred and twelve hundred at a price of one hundred twenty. The count remains ten. Comparing the two notional values without the price effect would exaggerate the change in outstanding contractual exposure.
Liquidation cascades require conditions
Insufficient margin can lead to additional collateral requirements or forced position reductions. Forced orders can move a thin book, which can affect other positions and create a feedback loop. The process nevertheless depends on each venue's mark price, maintenance margin, risk tiers, liquidation procedure, insurance arrangements, and possible automatic deleveraging. A line on a public map does not guarantee that a specified amount will liquidate at that price. Cross-margin accounts, hedges, and additional collateral can change the outcome. Public data rarely exposes an account's complete obligations across venues. Explain the mechanism as a conditional scenario rather than turning an estimated cluster into a certain price target or a timetable for a market move.
Public feeds may be incomplete
Liquidation streams can be throttled, aggregated, delayed, sampled, or interrupted. Some endpoints publish only a recent event rather than every event. Read the collection rules and state the actual coverage before adding values together. Missing data is not automatically zero. Even transparent on-chain positions can be offset elsewhere, and an address does not reveal the ultimate owner or all off-chain liabilities. When combining providers, deduplicate events and explain whether values use execution prices, mark prices, contract notionals, or another estimate. If completeness cannot be demonstrated, call the result observed liquidations within the collected sample. The phrase total market liquidations implies a scope that a partial feed may not support.
Build scenarios instead of predictions
Review price, volume, open interest, funding, spreads, and executable depth together, then state alternative explanations and the evidence that could distinguish them. Falling open interest can reflect voluntary closing, expiry, migration, or liquidation. Rising open interest can reflect hedging as well as speculation. A useful scenario table identifies the possible trigger, the data gap, and a counterexample. Personal risk controls should depend on affordable losses, the venue's rules, collateral arrangements, and liquidity rather than a public heat map. Keep the observation interval, definitions, source changes, and model assumptions with every published chart. Readers can then assess a bounded analysis instead of mistaking a precise-looking graphic for knowledge of all positions or a guaranteed market destination.
Expiry, settlement, and contract rolling can change outstanding positions without the same interpretation as fresh speculative demand. Annotate those structural events. Before adding products together, examine whether the dataset counts related exposure more than once. A change in coverage or contract specification should be disclosed alongside the chart rather than interpreted as a sudden shift in investor sentiment.