Original topic illustration: ChainView BTC866 original topic diagram · ChainView BTC866 Editorial · CC BY 4.0
Volume counts trades rather than people
An asset can change hands repeatedly, so reported volume is not a count of unique investors or net deposits. Venue and aggregator datasets may cover different pairs and products. Establish that scope before interpreting activity.
Unique users require identity or account-level evidence that trade counts do not supply. One large participant can split orders into many prints. Avoid rewriting rising transaction counts as an influx of new investors, especially when no public data supports an estimate of their account size or number.
Reported volume counts completed trades under a venue's methodology; the same units can change hands repeatedly without matching unique investors or net inflows.
Normalise the units
Base units, quote-currency value and derivative notional measure different things. Dollar volume can rise because prices rise while coin quantity is unchanged. Avoid duplicated pair aggregation and do not silently replace missing observations with zero.
Spot volume and derivatives notional cannot simply be added and called fresh capital invested. Leverage, multipliers and coin-denominated conversions change displayed scale. Keep a native-unit column beside the converted one, recording the price source and timestamp so another reader can reproduce the arithmetic.
Base-asset units, quote-currency value and derivatives notional are different measures; normalise units and time windows before comparing them.
Investigate incentives carefully
Rebates, competitions and self-trade rules can alter activity. Circular or wash trading can inflate apparent interest, but a suspicious chart alone does not prove misconduct by a named venue. Distinguish anomalies, methodological estimates and established findings.
Unusual distributions can justify research, but conclusions need an evidence level. Falling volume after a reward programme may reflect changing incentives, not proof that every earlier trade was fictitious. When naming an institution, rely on established public findings and distinguish them from an analyst's unexplained pattern.
Wash trading and economically circular activity can inflate apparent interest, while fee rebates or trading competitions can change participants' incentives.
Compare depth with the reported flow
Imagine two markets with equal daily volume but different order-book depth and spread. Their ability to execute a large order can differ sharply. Combine trade distributions and independent sources; never conduct a real-money self-trading experiment to test a suspicion.
An order-book snapshot is not a promise because orders can be cancelled. Combine observations over time with actual execution statistics, while separating read-only research from real fills. Activity quality requires several dimensions; one metric cannot cover available capital, cost, liquidity and counterparty risk by itself.
Use independent evidence, order-book depth, trade distributions and published self-trade rules, but do not accuse a named venue of manipulation from a single chart.
Explain revisions and uncertainty
Keep the source, unit, product and time window. A provider's revised history can reflect changed coverage rather than changed demand. Attribute unverified figures clearly and explain the remaining gaps, so the largest published number is not automatically treated as the highest-quality market.
When venue and aggregator totals differ, check time zones, excluded pairs and filtering rules first. Preserve retrieval versions rather than silently replacing yesterday's history with a newly downloaded curve. An explained discrepancy can reveal a methodological change and is more valuable than forcing every chart into artificial agreement.
A review can sample several completed intervals and compare native volume with its reported converted value. If conversion differences remain, record the assumption rather than forcing agreement. Check whether the feed counts a matched trade once or presents separate participant records. Duplicated exports can inflate a local total even when the source is accurate. That is a data-processing fault, not evidence of deliberate wash trading by the market operator.
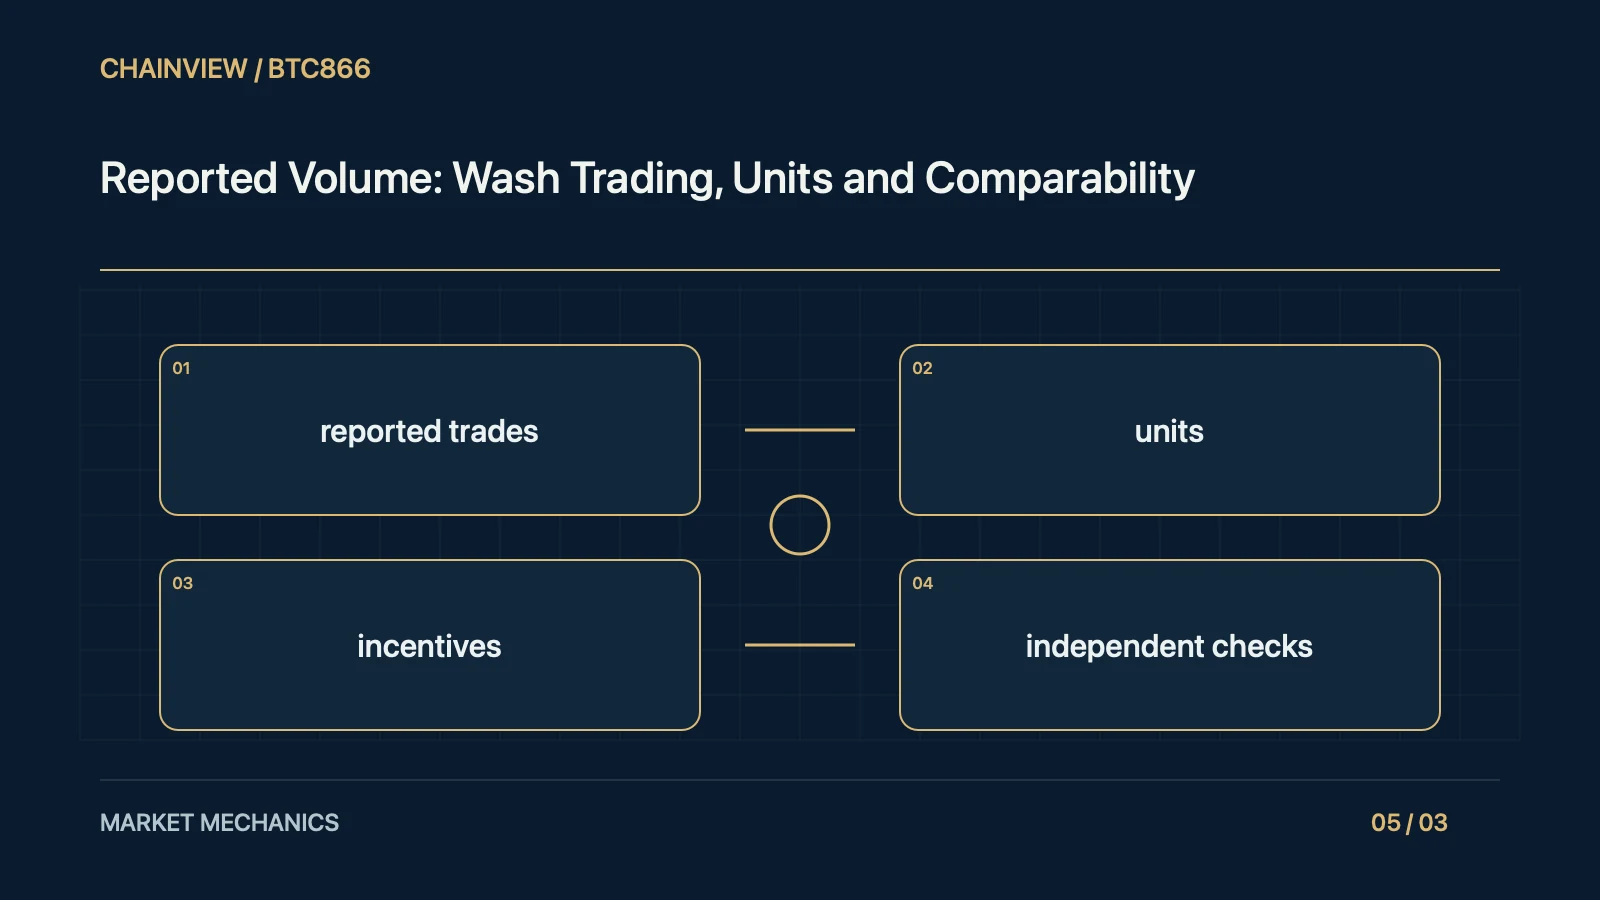
A useful worksheet for this topic has separate entries for reported trades, units, incentives and independent checks. Fix one set of fictional inputs, change one condition at a time and identify which conclusion moves. Retain units, observation time and source beside every number. An unknown input should remain unknown rather than becoming zero by default. The purpose is to expose methodological dependence, not select the most flattering outcome. Before using the result for a real-money decision, compare its assumptions with actual fees, available liquidity, household spending needs and the loss the user can afford. A clean calculation cannot remove those constraints.