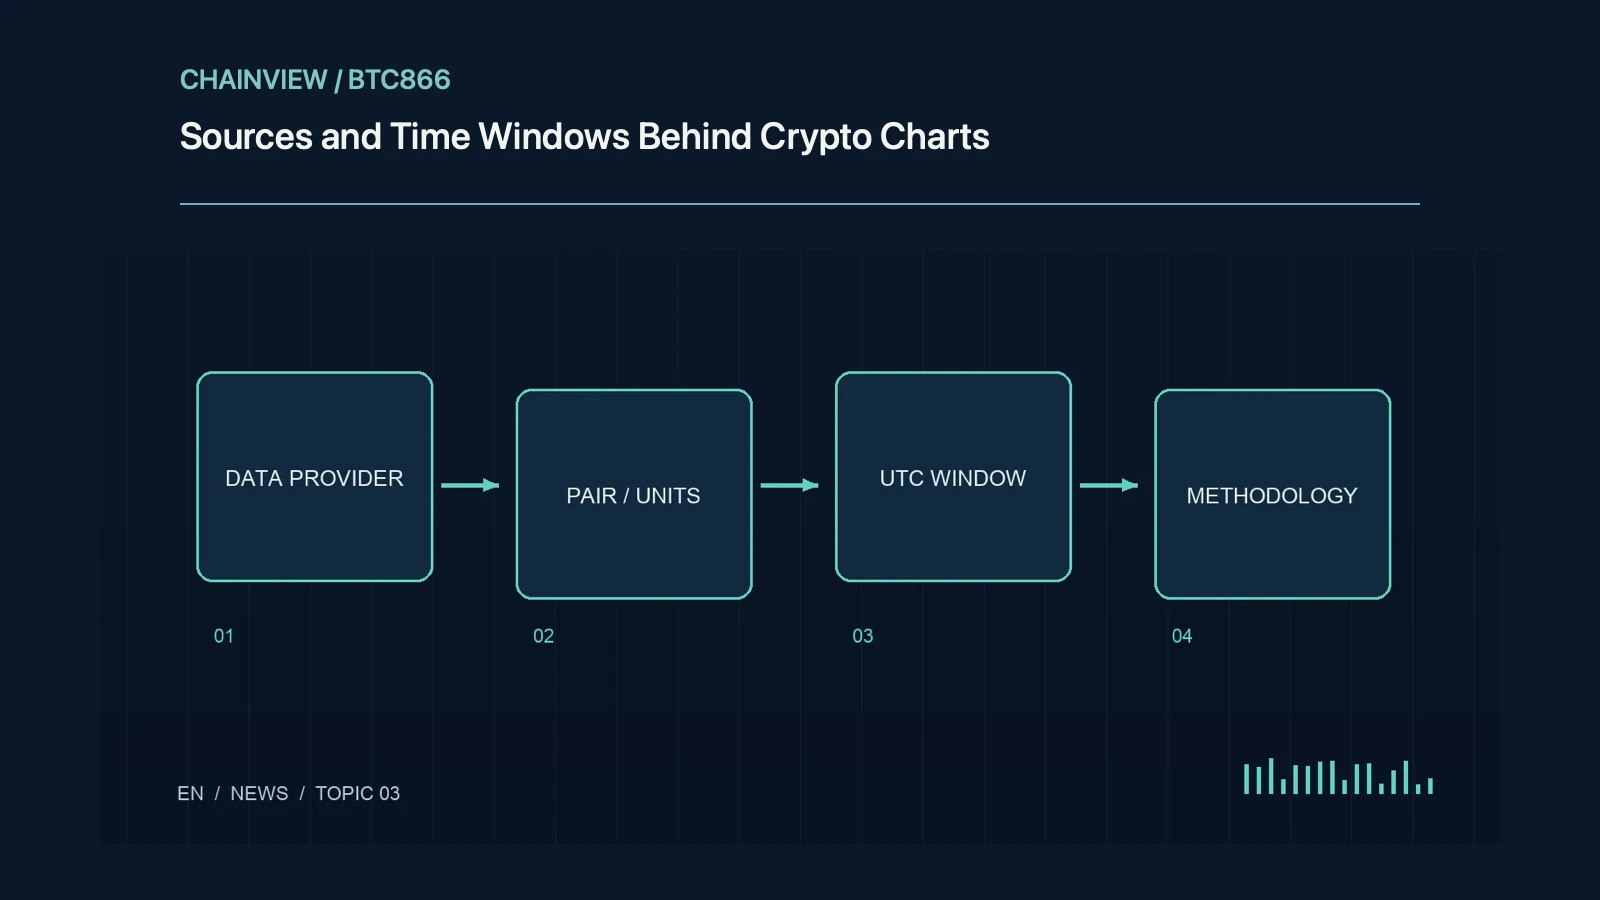
Original topic illustration: ChainView BTC866 original topic diagram · ChainView BTC866 Editorial · CC BY 4.0
Read the metric definition
Active addresses, transaction counts, volume, and total value locked measure different things. One person may control many addresses, and a custodian may serve many people through one address. Find the vendor definition and treatment of failures, bots, internal calls, and duplicate flows. Without that definition, do not describe the figure as a true user count.
Windows and time zones
Calendar days, rolling twenty-four-hour windows, and venue settlement days can disagree. Align boundaries, time zones, and sampling frequency. A month-end snapshot is not a monthly average. Determine whether dates follow block timestamps or ingestion times, and retain UTC alongside local time when cross-border publication could shift a daily observation.
Prices, quantities, and double counts
Dollar-denominated locked value can rise because token prices increase rather than because deposits grow. Bridges, receipt tokens, and collateralized borrowing can count the same economic value at several layers. Compare native quantities and constant-price estimates, disclose deduplication, and check whether assuming every stablecoin equals one dollar distorts periods of market dislocation.
Sample changes and revisions
New chain coverage, labels, and parser fixes can revise historical series. Save retrieval dates, query parameters, and dataset versions, and look for backfills or methodology changes. Before explaining a jump economically, rule out coverage, units, and contract migrations. Two vendors with different definitions should not be spliced into an apparently continuous trend.
Correlation and event attribution
A price move after an announcement establishes timing, not causation. Compare the broader market, peers, liquidity, and information already anticipated. State the event window before interpreting it, including unfavorable observations. Different endpoints can reverse a conclusion, and a one-day anomaly does not establish a durable adoption trend.
Enable reproduction
A reproducible chart includes a data entry point, metric, units, period, and transformations. Explain missing values, weighting, and whether an incomplete current week enters a weekly average. Retain exports and formulas. Where access restrictions prevent replication, disclose the limitation and avoid presenting an illustrative chart as precise empirical evidence.
Worked review example
Suppose dollar TVL rises from one hundred million to one hundred twenty million while token prices rise twenty percent and quantities remain unchanged. The chart cannot establish twenty million of new deposits. Also check whether the vendor added a protocol or counted a receipt asset twice. Keep native quantities, constant-price value, and current-price value in separate columns. These illustrative numbers isolate valuation effects from real flows. A defensible caption then states the observed value change and its measurement assumptions, rather than converting a price-driven increase into a claim about user deposits or adoption without additional evidence.